DEDICATED FOR: BETTING, MEDIA & SPORTS ORGANIZATIONS
STATSWIDGETS – Infographic widget
Provide your clients with a perfect way of presenting sports statistics by using STATSCORE’s Infographic widget.
This eye-catching solution enables bookmakers, media, sports organizations and fan clubs to display to their users the most accurate data in a visually-appealing fashion.
The sports statistics infographic widget is currently available for football competitions, and can be used to compare different teams’ statistics and data.
Prices starting FROM €1,000


Who can benefit from the Infographic widget?

MEDIA WEBSITES
Attract and entertain your visitors with beautifully designed data-packed infographics full of statistics from sports they love.

ONLINE BETTING COMPANIES
Inspire more bets by providing comprehensive analytical data displayed in engaging ways.

SPORTS ORGANIZATIONS AND FAN CLUBS
Provide football fans with advanced stats delivered in the most attractive fashion.
Key features
KEY DATA ON COMPETING TEAMS
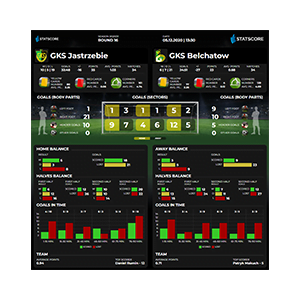
The Infographic widget is a perfect way to show the comprehensive statistics of competing football teams. The football data that may be displayed in graphical form and can include basic statistics on games won/lost/drawn, goals scored and lost, yellow and red cards, as well as advanced analytical data related to eg. body parts with which goals were scored or their timing!
EYE-CATCHING DESIGN
This good-looking sport widget has been designed to attract and entertain sports fans, viewers, and bettors. That’s why its look is so stunning – packed with the data and pleasing to see. Most importantly, its layout has been designed to make all the data easily accessible and understandable.
Available sports (1)

Soccer /Football
Infographic configuration options
The Infographic widget provides you with a set of options, which will allow you to set it up with your needs! The range of settings that you can configure include:
DISPLAY SETTING
- Client logo URL – add your logo to the infographic by providing its URL.
- Widget size – specify the size of the widget (at least 1920px to display correctly).


COLOR SETTINGS
- Design settings – choose the most fitting font family to match the look of your website or app.
- Color scheme – pick the colors of the Infographic H2H widget, choosing the main background color, font color, colors of the lines, etc.
CHECK OTHER EVENTS WIDGETS
Provide all the info about chosen sports events – educate your users with the updates on lineups, let them vote for the team they think is more likely to win, and much more!
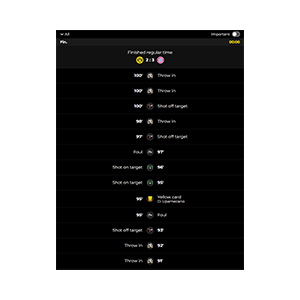
EVENT INCIDENTS
Provide your users with live timeline
of the most important incidents
taking place during a game.
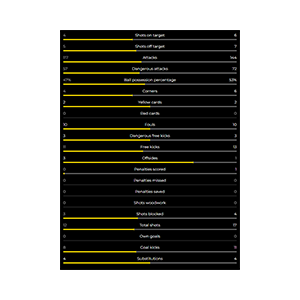
EVENT STATS
Display real-time data and detailed statistics on key match events
(shots, corners, attacks, fouls, etc.)
INFOGRAPHIC
Entertain and inspire your visitors by showing them beautifully designed
data-packed infographics.
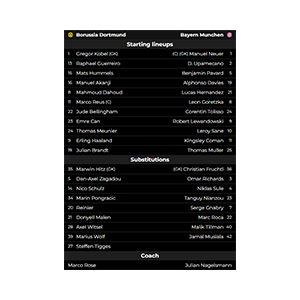
LINEUPS
Keep your users informed by showing
them data on starting lineups,
substitutes, and coaches of the teams.
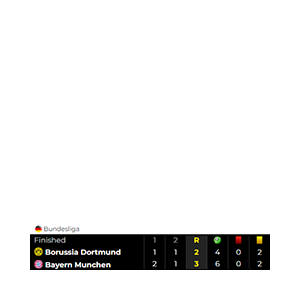
SCOREBOARD
Display data on the current score
of a game, along with other stats
(e.g. yellow cards, corner kicks).
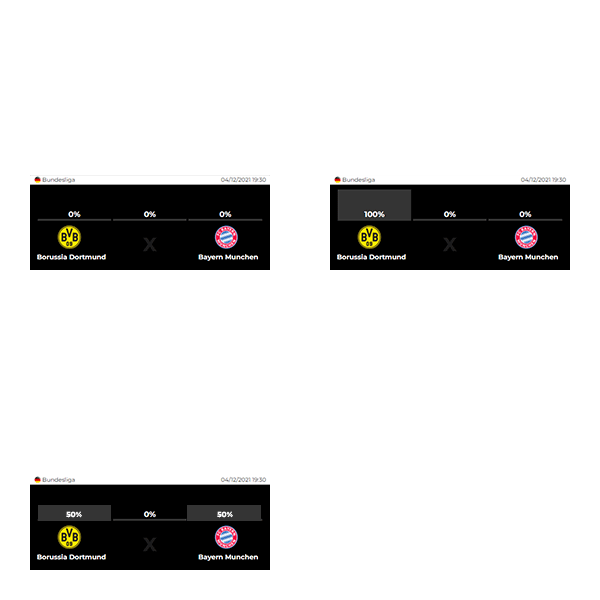
VOTE
Let your visitors share their predictions
by allowing them to vote on the
team/player they find more likely to win.
